About Pesticide Repurposing with KGE
Why peticide repurposing
Pesticides play an indispensable role in agricultural production by effectively controlling pests and diseases, significantly reducing the damage caused by harmful organisms to crops . According to data from the Food and Agriculture Organization (FAO) of the United Nations, pesticide use prevents the loss of 30-40\% of the world's total crop production. However, the irrational and excessive use of pesticides in modern agricultural practices has led to increasingly severe resistance issues. In some cases, it renders existing control methods ineffective, posing a significant challenge to sustainable agricultural development. Moreover, developing new pesticides is a complex and time-consuming process, involving extensive preliminary research, rigorous field trials, and lengthy regulatory approval procedures. International data show that developing a new pesticide requires testing 159,000 compounds, investing $286 million, and an average 11.3-year development cycle. These challenges further exacerbate the severity of the pesticide shortage problem. In this context, applying the drug repositioning strategy from medicine to explore the repurposing of pesticides has huge potential in the future.
Drug repurposing, or old drug for new use, is considered a vital strategy for enhancing resource efficiency and accelerating the development of new therapies. Despite significant achievements in the pharmaceutical industry, there has been limited progress in pesticide repurposing within the agricultural sector. Therefore, achieving pesticide reuse through AI is a precious and worthwhile scientific research topic.
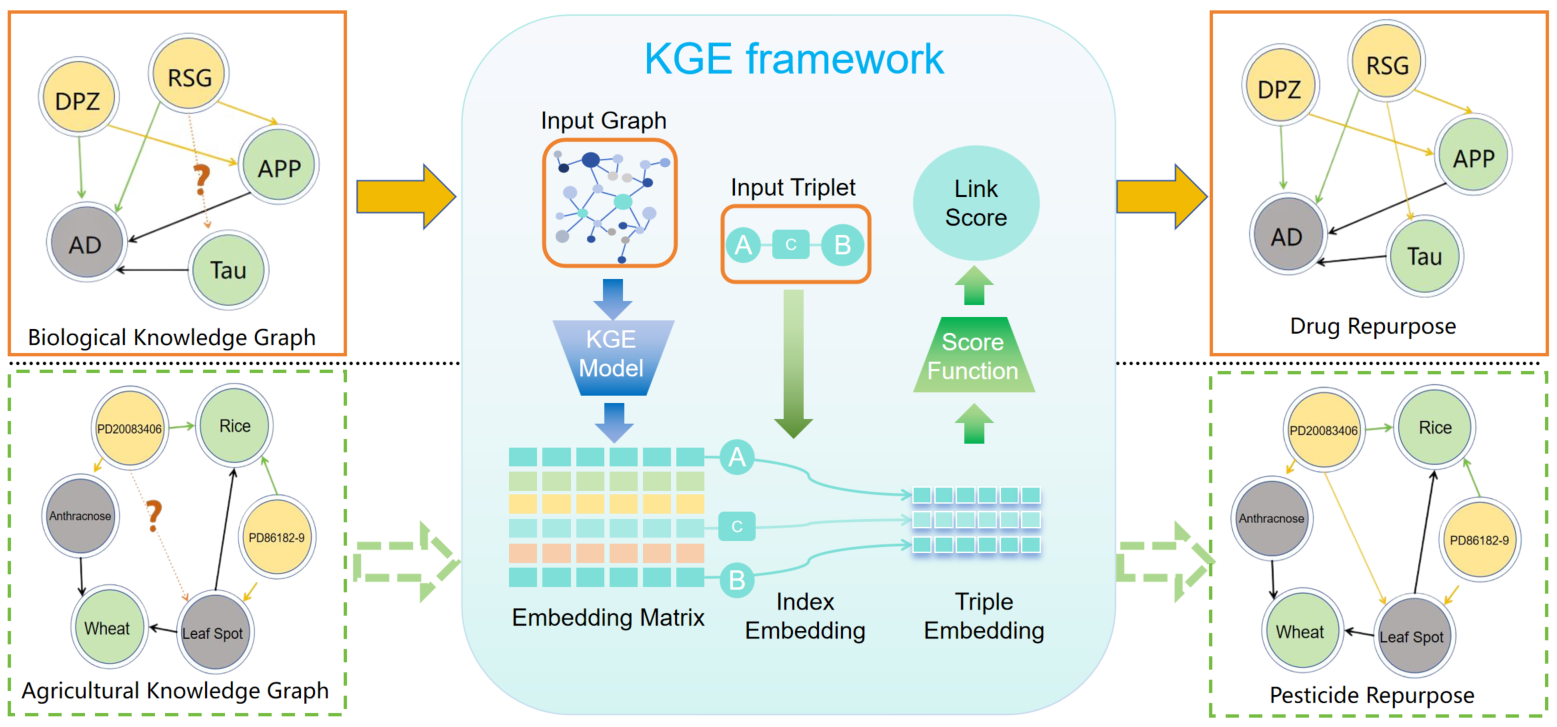
Figure 1. The motivation of Pesticide Repurposing. In the pharmaceutical field, AI technology can predict the potential new functions of drugs. Since pesticides are also a type of drug, can the "repurposing" strategy in medicine be applied to predict new functions of pesticides using AI technology.
Why KGE
Traditional evaluation methods are highly subjective and labor-intensive, and are not suitable for large-scale data. Machine learning-based methods have achieved a certain degree of automated evaluation, but the performance of these machine learning methods heavily depends on high-quality feature engineering. Deep learning methods have further promoted the development of evaluation in a more accurate and simpler direction. However, these methods mainly rely on global image disease features and can easily mistake background information for the lesion area, resulting in a bias in the severity assessment, as shown in Figure 1. To address this issue, we adopt a location-guided learning strategy to acquire prior knowledge of the lesion area, allowing us to extract features focused on this region.
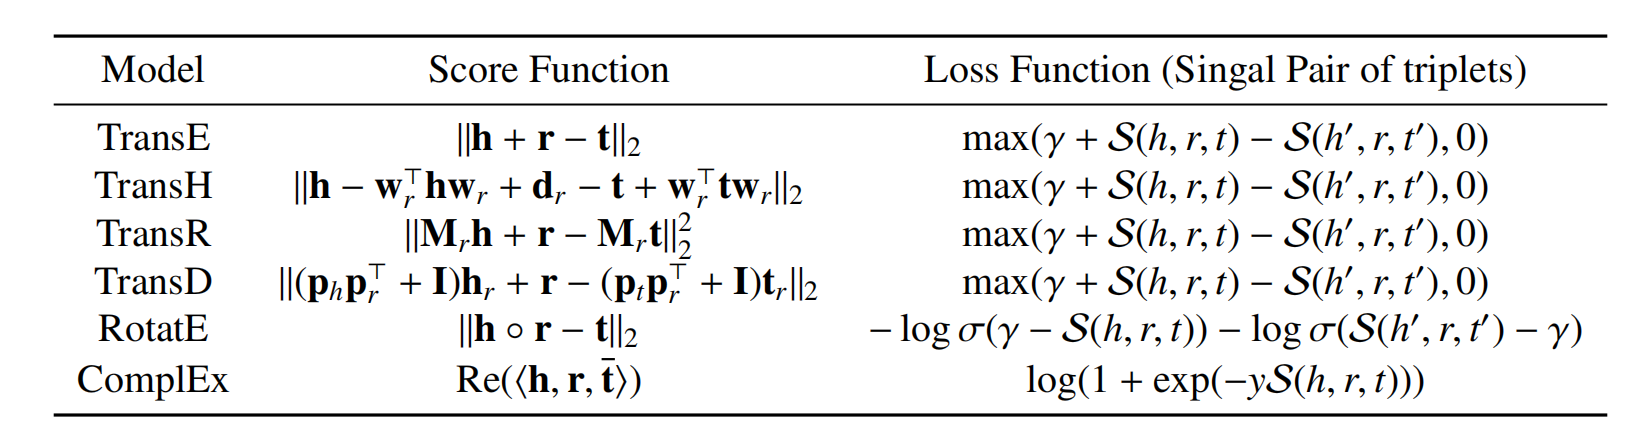
Table 1. KGE model: \(h, r, t\) represent the embedding vectors of the head entity, relation, and tail entity respectively, \(\mathbf{w}, \mathbf{m},\mathbf{p} \) are the transformation matrices. Re represents the real part of the complex number, \(S\) represents the score of entity \(h, t\) in relation \(r\). \(\gamma\) is the minimum score difference limit between positive and negative sample scores, also known as margin. \(\sigma\) is the activation function
To better understand the KGE models, Figure 2 illustrates the geometric representation of Trans-series models in a two-dimensional space. For dimensionality reduction and visualization, all entities and relations are set to a dimension of 2 and can be represented by two-dimensional vectors
Figure 2. Geometric Explanation of Trans Series Models. In the TransE (a) and TransH (b) models, entities and relations are in the same vector space, but TransH projects entities to the relation plane. In the TransR (c) and TransD (d) models, entity and relation spaces are two different spaces. TransR determines the mapping matrix $\mathbf{M}_r$ only through relations, while the mapping matrices $\mathbf{M}_{r,h,i}$ and $\mathbf{M}_{r,t,i}$ of TransD are determined by both relations and entities.
Case Studies
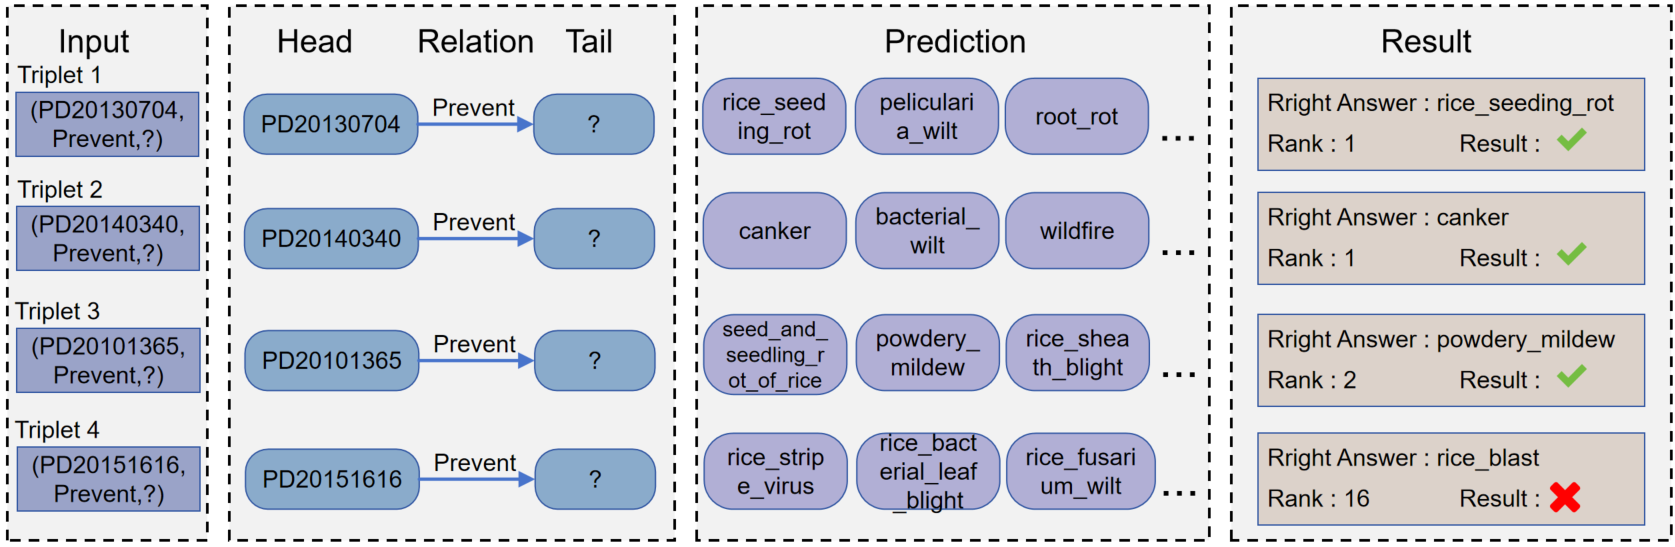
we show some case studies with three correct and one incorrect predictions in the Pesticide knowledge graph dataset. In the experiment, entities and relationships are formed into mapping IDs and stored in mapping files. The case in the figure shows the intuitive results obtained after parsing the file. In order to predict tail entities, the head entities and relationships are embedded into known feature vectors to find potentially correct tail entities in the form of (h,r, ?). In the entire test set, all entities except for the head entity appear as potential candidate entities in the predicate. When the model runs and receives inputs h and r, calculate the scores of all candidate entities and sort them. Missing tail entities can be perfectly predicted in triplets 1, 2, and 3 (eg. triplets 1,2,3). Correspondingly, the model usually ranks the correct candidate more towards the bottom than the top 10, when the model does not have the ability to predict the missing head or tail entities (eg, triplets 4)
Research Team
SAMLab